
|
Software update |
|
| |
|
Hydrologic Risk · hydraulic analysis
A new steady-flow engine, validated cross-section by cross-section
|
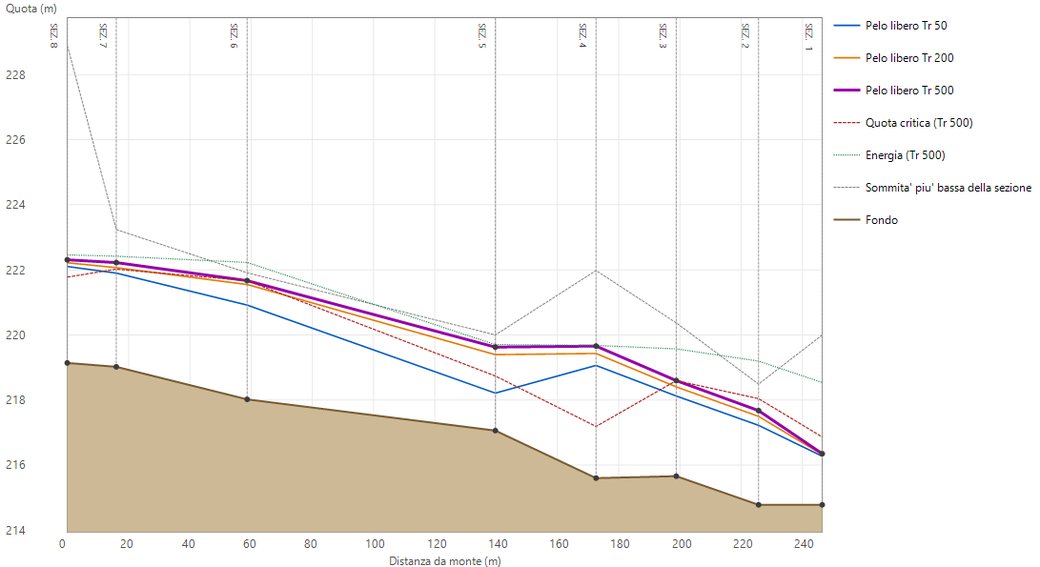
Water surface profile for return periods of 50, 200 and 500 years, with critical elevation and energy grade line, computed by the new engine on the tutorial project.
|
|
Dear colleague,
Hydrologic Risk now has a new computation engine for steady flow analysis. The water surface profile is computed in mixed regime: the program decides, cross-section by cross-section, where the flow is subcritical and where it is supercritical, and locates the hydraulic jump, without you having to choose the computation direction in advance.
Before releasing it we tested it against analytical solutions, against the official USACE examples and against HEC-RAS 6.6. On the analytical cases the difference from the reference is below 0.1 mm; on the Mixed Flow Regime Channel example it is at most 0.2 mm, with the jump at the same cross-section. The validation dossier is published on geostru.eu.
|
|
How the new engine works
|
|
Standard step, with no scan step to set — the energy balance is imposed between consecutive cross-sections and the depth is obtained by solving the equation directly. Reaches that are too long are split into sub-steps. |
|
Mixed regime, jump by momentum — subcritical flow is computed from downstream to upstream, supercritical flow from upstream to downstream; at each cross-section the profile with the larger specific force M = A·yG + Q²/(gA) prevails. Where subcritical flow prevails, the jump forms. |
|
Separate channel and overbanks — each cross-section is split into left overbank, main channel and right overbank, each with its own Strickler Ks. Conveyance K = Ks·A·R2/3, Coriolis coefficient α from the conveyance distribution, average friction slope from the conveyances of the two cross-sections. |
|
Contraction and expansion losses — in addition to friction, local losses on the change in velocity head (coefficients 0.1 and 0.3). |
|
Boundary conditions at both ends — for each return period: normal depth, critical depth or known water level, downstream for subcritical flow and upstream for supercritical flow. When in doubt, normal depth at both ends. |
|
Warnings and results — at the end of the run the program flags cross-sections that are too far apart, passages through critical depth and regime changes. For each return period: profile with critical elevation and energy, and a copyable table with discharge, depth, velocity and Froude number. |
|
|
The validation
The dossier follows the structure required by the Italian building code NTC 2018 (§10.2) for the reliability of computation software. HEC-RAS 6.6 was run with a 0.1 mm tolerance instead of the default 3 mm, for a like-for-like comparison.
| Test |
Result |
Analytical cases
7 profiles (M1, M2, S2, jump), 1,307 cross-sections |
within 0.1 mm of the reference, within 2 mm of HEC-RAS; same regime at every cross-section |
Official USACE examples
Mixed Flow Regime Channel, Critical Creek, Channel Modification |
mixed regime: max 0.2 mm, jump at the same cross-section; median difference of 1.6–1.8 cm in the other two |
9 real projects
exported from Hydrologic Risk to HEC-RAS |
8 out of 9 within 1.2 cm, with a median difference below 1.3 mm |
Where the differences grow, the dossier explains why, cross-section by cross-section: these are reaches where HEC-RAS itself does not balance the energy equation, or where a cross-section has two energy minima. The test case files can be downloaded by licensed customers.
|
|
Read the validation dossier
|
Also in this version
|
|
HEC-RAS import and export — Export HEC-RAS writes the complete project (.prj, .g01, .f01, .p01) for a cross-check; Import from HEC-RAS brings an existing project into Hydrologic Risk. |
|
Rainfall from Hydrogeo NX — search for the rain gauge by name and the annual maxima for 1, 3, 6, 12 and 24 hours are loaded into the project; Gumbel and the depth-duration curve h = a·tn are recomputed for each return period. |
|
Catchment from GeoStru Maps — one click on the river at the outlet: watershed divide, stream network and main channel from the TINITALY 10 m DTM (INGV), with area, elevations and slope. The catchment arrives in Hydrologic Risk already triangulated, without going through a GIS. |
|
Flood maps, also in 3D — the computed water surface is interpolated between cross-sections and compared with the DTM: flooded area, volume and maximum depth for each return period, in plan and in the 3D view, one return period at a time. |
|
Drawings with CAD Tools — the plan with the flood map opens as a DXF in CAD Tools, in the browser: take measurements, then set sheet size, scale and title block with Compose sheet. A free GeoStru account is all you need to save and print. |
|
The new manual — online at help.geostru.io in English, Italian, Spanish and Romanian. The steady-flow page explains how the program computes and how to choose the boundary conditions. |
|
|
The full tutorial
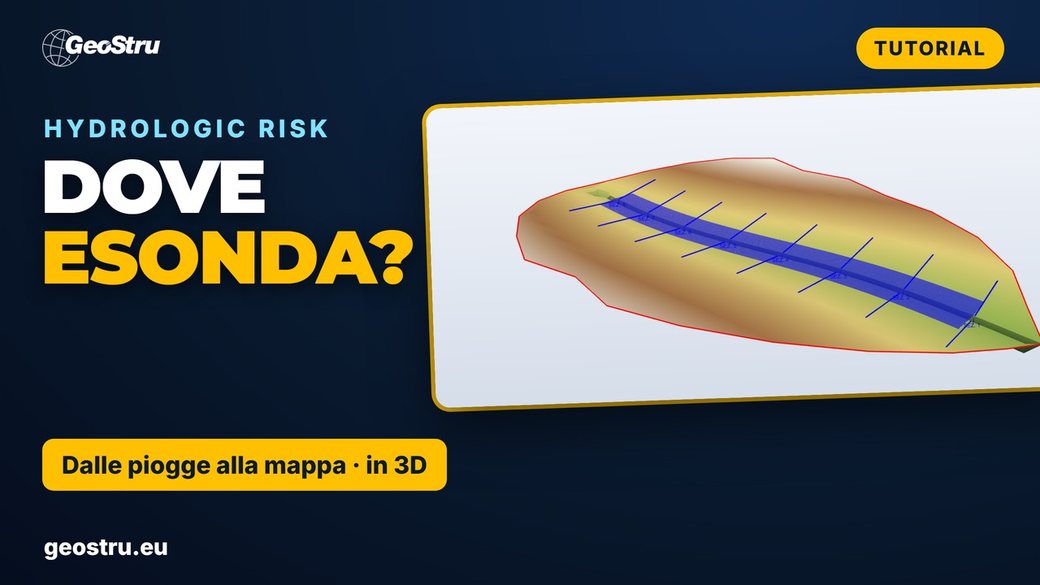
20 minutes, 16 chapters, on a real 76 km² catchment: from rainfall to the flood map. The video is in Italian; boundary conditions and steady flow start at 12:42.
|
| Do you have Hydrologic Risk with an active update service? The new version is included: open the program and use Check for updates, or download it from your customer area. |
|
|
Download the update
|
|
Find out more
|
If you have any questions, we are here to help.
Kind regards,
The GeoStru team
|
|
GeoStru
You receive this email as a GeoStru customer.
Unsubscribe
|
|