|
Drag a PDF of a hydrological annal, the AI recognizes the station and populates the rainfall series in 10 seconds ͏ ͏ ͏ ͏ ͏ ͏ ͏ ͏ ͏ ͏ ͏ ͏ ͏ ͏ ͏ ͏ ͏ ͏ ͏ ͏ ͏ ͏ ͏ ͏ ͏ ͏ ͏ ͏ ͏ ͏ ͏ ͏ ͏ ͏ ͏ ͏ ͏ ͏ ͏ ͏ ͏ ͏ ͏ ͏ ͏ ͏ ͏ ͏ ͏ ͏ ͏ ͏ ͏ ͏ ͏ ͏ ͏ ͏ ͏ ͏ ͏ ͏ ͏ ͏ ͏ ͏ ͏ ͏ ͏ ͏ ͏ ͏ ͏ ͏ ͏ ͏ ͏ ͏ ͏ ͏ ͏ ͏ ͏ ͏ ͏ ͏ ͏
|
| |
Dear Professional,
We are proud to present Runoff Lab NX, the new web version of our hydrological suite for the analysis of annual maximum rainfall and the construction of flood hydrographs. After years of developing the desktop Runofflab software and continuously listening to professionals like you, we have decided to bring all the accumulated methodological heritage online, enriching it with artificial intelligence features that will change the way you build a hydrological study.
|
|
|
|
| |
What changes compared to the desktop version?
No installation — it works from any browser, on PC or tablet, with projects accessible and shareable from multiple workstations: - Four probabilistic distributions side-by-side in the same AI editor
- Import that reads PDFs, images, and scans of hydrological annals
- Direct integration with Hydrogeo NX via API for Italian stations
- Multilingual PDF report ready to be delivered
|
|
|
|
| |
The entire hydrological workflow in a single file
Measurement stations with live statistics (mean, standard deviation, coefficient of variation, skewness) calculated in real time. Four probabilistic families available in parallel: - Gumbel — moments and maximum likelihood
- GEV — Hosking-Wallis L-moments (WMO standard)
- Pearson Type III — Foster-Kite method
- TCEV — four regional levels with pre-installed VAPI dataset
|
|
|
|
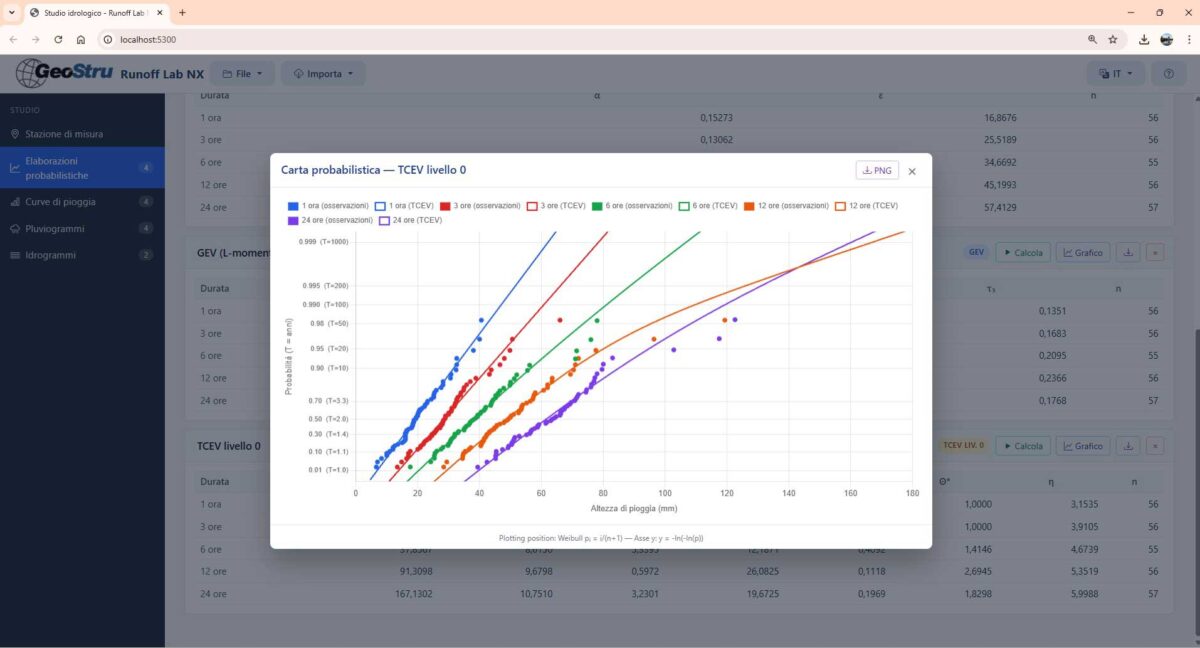
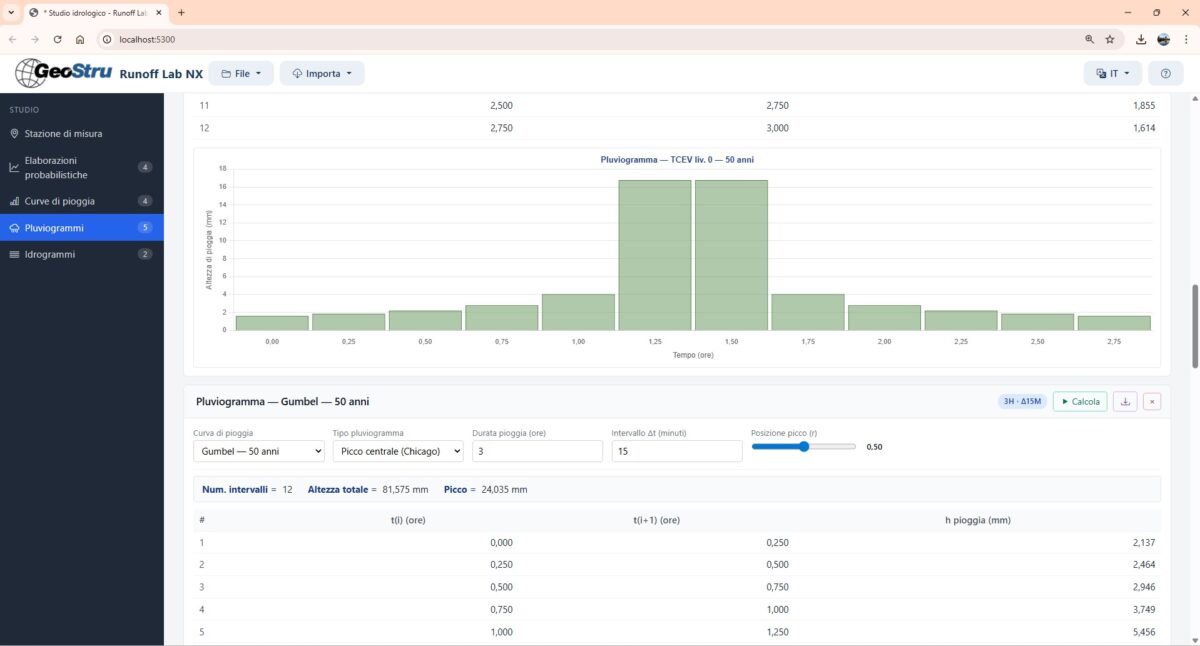
| |
Gumbel probability plot with Weibull plotting position, to compare at a glance which model best follows the distribution of the observed sample.
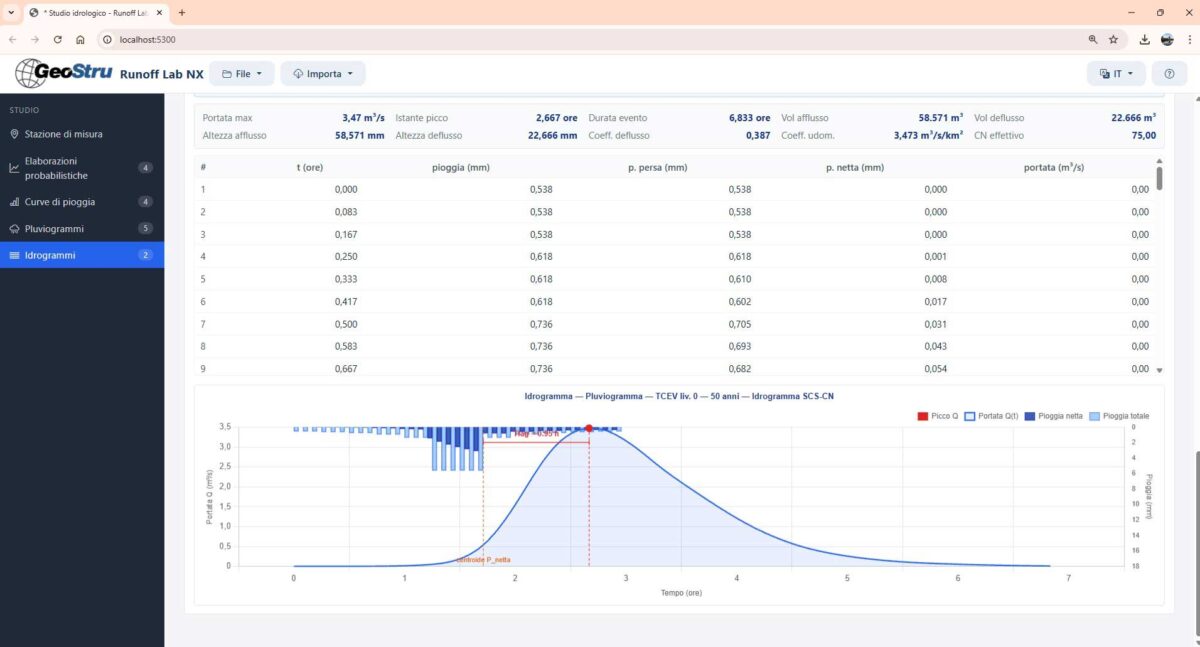
From any processing, you obtain in one second: IDF rainfall curve (log-linear regression in the logarithmic plane, a, n, R parameters), Keifer & Chu 1957 synthetic Chicago hyetograph with configurable peak, and finally flood hydrograph with the SCS-CN method — convolution between net rainfall and dimensionless unit hydrograph, returning peak discharge, time to peak, volumes, and runoff coefficient.
|
|
|
|
| |
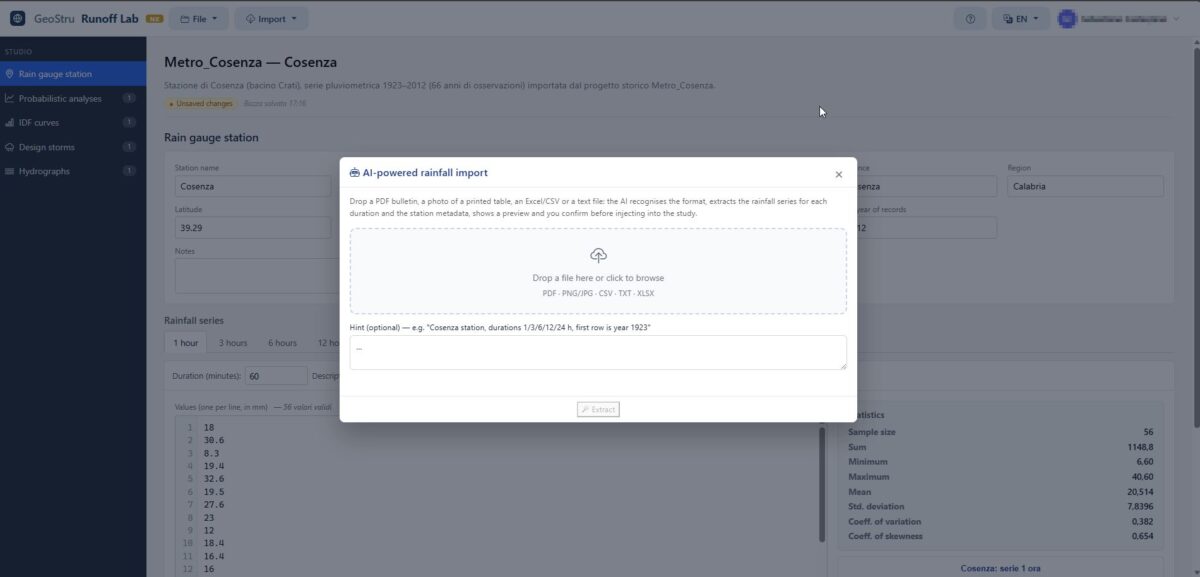
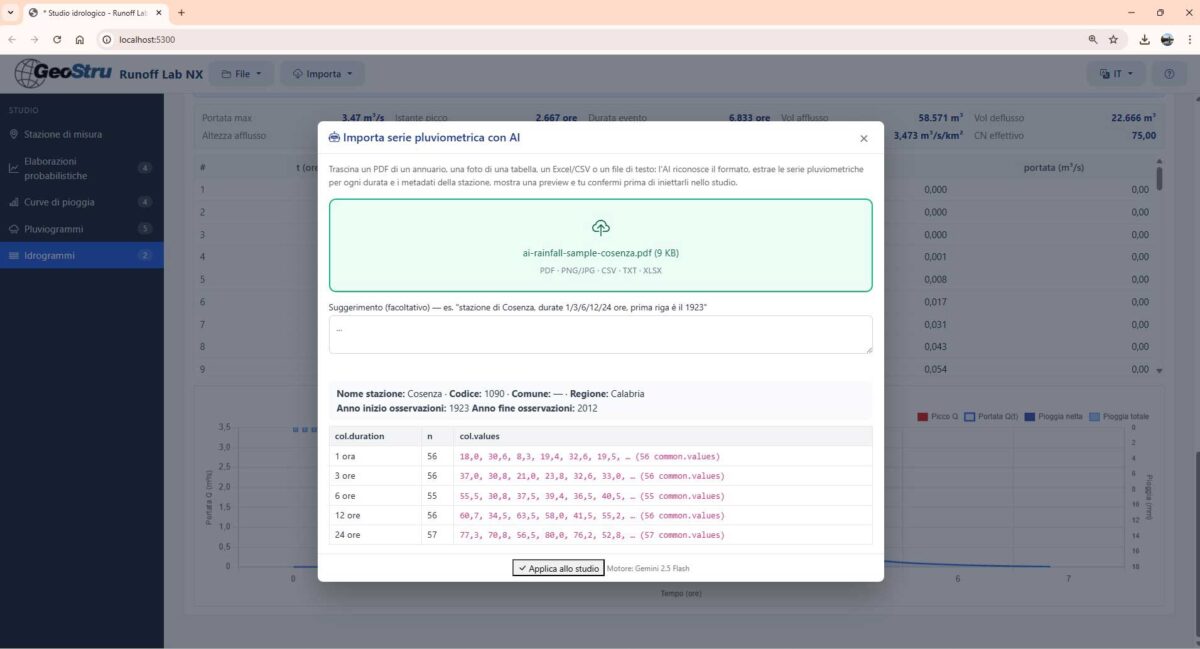
The novelty: AI Import
Imagine having archives of regional hydrological annals in PDF, scans of paper printouts, photos of historical publications, Excel files with non-standard formats, merged cells, and header rows that do not follow any pattern. Runoff Lab NX reads EVERYTHING. The AI visually interprets the document, recognizes the station, the years of observation, the rainfall depths for the different durations, and populates the complete rainfall series in a few seconds.
|
|
|
|
| |
The workflow that previously required half an hour of manual copy-pasting now takes about ten seconds.
And no invented data: if a column is ambiguous, the AI states it in the notes. You review the tabular preview, confirm, and with one click the data is in the correct rainfall series, with the right duration.
A feature that currently has no precedent in the applied hydrology sector
|
|
|
|
| |
The beginning of an ecosystem
Runoff Lab NX joins Stratigrapher NX, Liquiter NX, RSL III NX, Computo NX, GDW NX, Section NX, Trispace NX,, and GMS NX in the GeoStru NX suite: a family of web applications that communicate with each other through a single project file and the geostru.ai APIs.
Upcoming modules:
- Dynamic NX — DPSH/SPT tests
- Static NX — CPT/CPTU tests
- Laboratorio NX — laboratory tests
A single study, data shared among all modules, without ever repeating data entry.
|
|
|
|
| |
🚀 Try Runofflab NX now
The app is online and available
|
|
|
|
| |
We thank you for the trust you continue to place in us, and for the suggestions that many of you have sent us in recent months, which have guided the development of this new version.
We remain at your disposal for any technical questions.
The GeoStru Team
GeoStru Software
www.geostru.eu | www.geostru.ai
Follow us on social media
|
|
|
|