
Description
CUSTOMIZING ANALYSIS
The user can choose different ways to process the data, choosing the most appropriate methods for the directional sum of the traces in the horizontal directions, for the smoothing and for the frequency band to be analyzed. The user can choose from the most simple arithmetic mean to the mean square or geometric mean among the directional sums available. Among the methods for data smoothing suggested by the SESAME project can be chosen: by Konno & Ohmachi, Triangular constant and Triangular proportion. The user can choose the time windows to include or exclude with a simple checkmark, seeing in real time the changes made. The input data can be automatically filtered.
DISPLAYING DATA
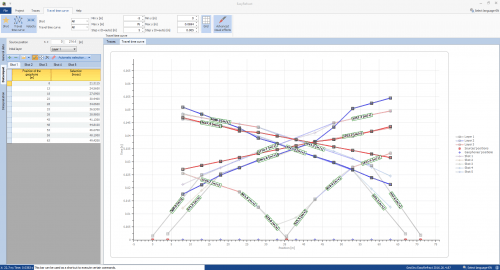
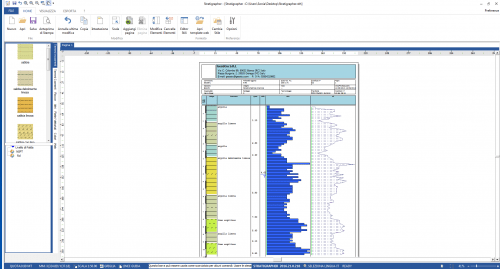
All results are displayed in customizable charts. The available charts are the traces in the three directions analyzed with the representation of the time windows chosen; the average spectrum of the traces; the map for the verification of the recording’s stationarity; the map for the verification of the recording’s directional isotropy; The spectral ratio H/V with its confidence interval, having them with the possibility to overlap the ellipticity curve of more stratigraphic models not only of the fundamental mode, but also higher ones; the graphical representation of the stratigraphic profile; the velocity profile associated with the stratigraphy.
RESULTS
The software automatically evaluates a first estimate of the stratigraphic model that best approximates the H/V spectral behaviour recorded in situ and analyzed so the user can refine it more rapidly. Is thus obtained, in addition to the natural vibration frequency of the stratigraphy typical to the HVSR technique, the immediate assessment of Vs30 and the shear wave velocity profile of the stratigraphic model assumed. On the chart of the spectral ratio, H/V are visible; in addition to the H/V curve with its confidence interval, all the ellipticity curves of the various modes of each stratigraphic model that the user can decide to add. In this way, it is possible to compare the differences from a qualitative point of view, and in addition, also a quantitative comparison with the estimate of the mismatch function between the ‘fundamental’ ellipticity curve and the curve of the spectral ratio H/V. Checks accompany all on the reliability of the H/V curve and its peak suggested by the SESAME project.


gerardo santini (verified owner) –
buon software . Lo trovo abbastanza scorrevole e intuitivo. Da poco che lo uso e quindi non mi esprimo sulla qualità dei report ma sembra funzionale per la definizione del modello sismico locale
FABRIZIO CITARRELLA (verified owner) –
Buon software. Nella sezione “Cenni sulla teoria della tecnica HVSR” della relazione sismica, bisogna correggere la dicitura Vs30 con Vs, eq
filippo catanzariti –
Buongiorno
Lo faremo oggi ti inviero’ il file per email
***
Hi
We will do it today. I will send you the file by email
Thanks
Paolo Nania (verified owner) –
Software molto versatile ed intuitivo.
Personalmente, il programma si potrebbe implementare consentendo di aprire e comparare piu’ spettri H/V al fine di poter fare delle speditive valutazioni di zonazione sismica.