

Description
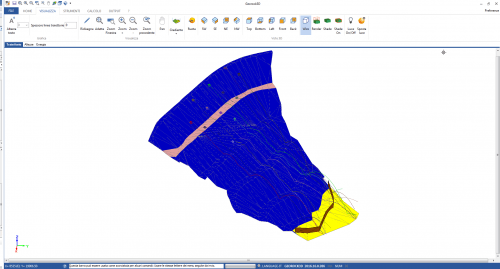
To determine the rock’s geotechnical model, the stages of the joints survey will be illustrated, referring to geo-structural conditions (spacing, aperture, persistence) and to hydraulic and joint strength conditions (roughness, wall strength, degree of alteration, filling materials).
The procedure used for performing the survey is described in the ISRM recommendations, “Suggested Methods for the Quantitative Description of Discontinuities in Rock Masses”.
PROJECTIONS AND PLOTTING
• WULFF DIAGRAM
It is the stereographic projection of the terrestrial meridians and parallels on a plane passing through the centre and to the two poles. It is an isogonal projection, in which the angles between the individual planes are retained on the projections, for which the areas defined by the intersection between two parallels and two meridians are strongly distorted from the centre towards the edges of the net.
• SCHMIDT-LAMBERT DIAGRAM
It is used to prevent the areal distortion of the Wulff diagram and is, therefore, suitable for statistical interpretations. Arcs of ellipses represent the great circles.
• EQUAL AREA, EQUIANGULAR AND STEREOGRAPHIC POLAR DIAGRAM
They are similar to the previous ones, representing the joint poles.
• STAR DIAGRAM
Representation of joints’ measurements. the observations are represented on a circular reference marked from 0 ° to 360 ° and radial lines at intervals of 10 °. The observations are grouped in the 10° sector to which they belong. The number of observations is represented in a radial direction relative to the circles corresponding to 5, 10 and 15 observations.
• ISODENSITY DIAGRAM
Several joint families can be recognised from the distribution on the poles grid corresponding to a significant data set. To achieve this goal are plotted the isodensity diagrams, the place of centres of unit areas that contain the same number of poles. The unit area is conventionally equal to 1% of the total area of the diagram. The method used to investigate the distribution of the poles’ density is developed by Denness, who has divided the reference sphere into 100 elementary cells.
GRAPHICAL RESULTS
• PERCENTAGE OCCURRENCE GRAPHICS
It is a type of graphic (histogram) where are represented, as a percentage, all occurrences of joints in the subdivision classes of the joint features to be represented (aperture, spacing or persistence).
• MODAL VALUE
In a histogram shown, for each joint family, the distribution of the characteristic (aperture, spacing, persistence). The user can plot sequentially all the measured families.
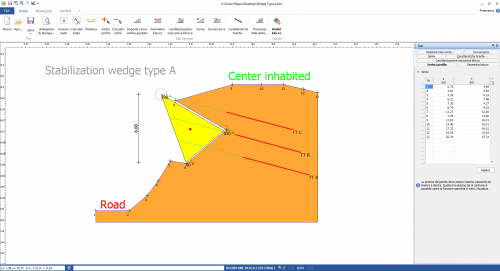
STABILITY ANALYSIS
• MARKLAND TEST
The Markland test aims to quantify the possibility of rock wedge failure in which the sliding occurs along the intersection line of two planar joints. The test is used to evaluate critical joints, so more detailed stability checks must follow it. Hocking has implemented further development of the Markland test. The test, in fact, allows the possibility that the sliding occurs along one of the planes that constitute the wedge and not only along the intersection line of the two planes themselves.


Reviews
There are no reviews yet.